Explore the dynamic world of our Retail Sports Shop through the lens of insightful data
visualization. Leveraging the power of Power BI, I've crafted an interactive dashboard that
provides a comprehensive overview of key metrics, sales trends, and performance indicators. Dive
into a visually compelling representation of our retail landscape, where Power BI transforms raw
data into actionable insights, empowering informed decision-making for a thriving sports retail
experience

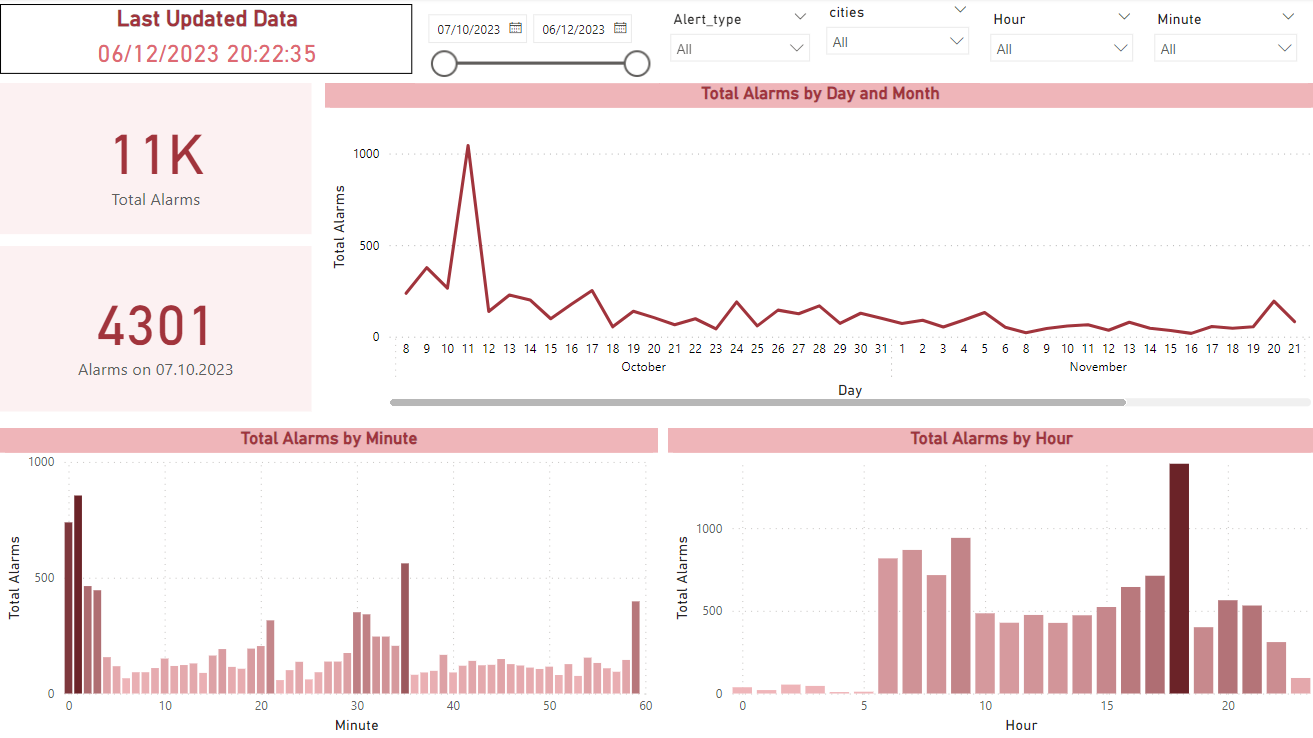
Welcome to the War Alarm Data Dashboard, a powerful tool designed to provide real-time insights
into alarm patterns since the beginning of the war on 07.10. Leveraging the capabilities of
Power BI and connecting seamlessly to a dynamic dataset through an API, this dashboard is
engineered to monitor and analyze critical aspects of alarm data.
The dashboard connects in
real-time to a comprehensive dataset via an API, ensuring that the information presented is
up-to-date and reflective of the evolving situation since the onset of the war on 07.10.

In this project, I developed a data-driven solution aimed at predicting the likelihood of an
individual suffering a stroke based on various health parameters. The project involved a
comprehensive data cleaning process to handle missing and inconsistent data, followed by the
application of machine learning classification techniques. The dataset included features such as
age, gender, BMI, smoking habits, and medical history (e.g., hypertension, heart disease).
I implemented several classification models, including Logistic Regression and Random Forest,
and evaluated their performance using accuracy, precision, recall, and F1-score metrics.
Hyperparameter tuning was conducted to optimize the models and enhance their predictive
capabilities. The goal of this project was to identify high-risk individuals based on historical
data and provide insights into the key factors contributing to stroke risk.
This project showcases my ability to work with health-related data, perform advanced machine
learning tasks, and deliver actionable predictions in the medical field.
Working together with team partner @TalSegev
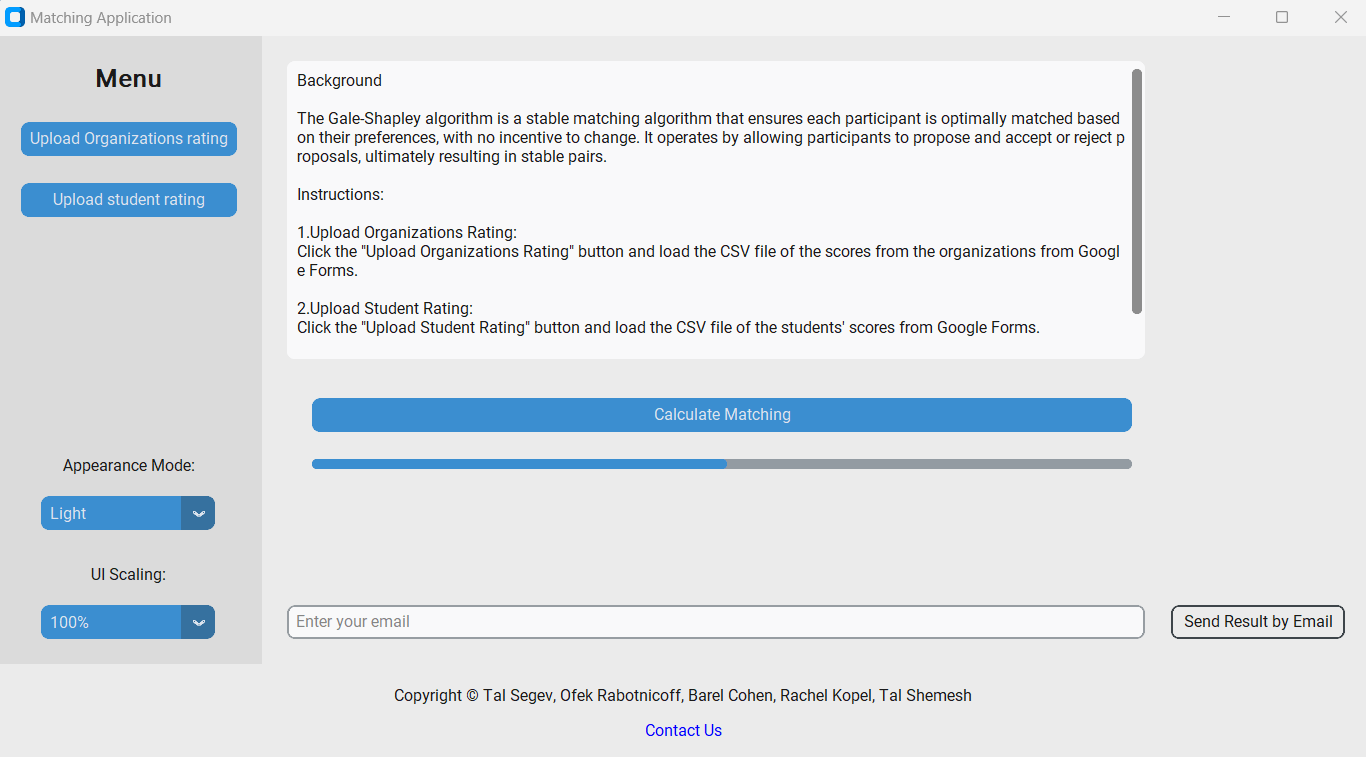
Our project addresses the challenge of subjective student placement at "Azrieli - Academic
College of Engineering" by introducing the Gail-Shepley stable matching algorithm. Traditional
methods, based on intuition, led to compatibility issues and high dropout rates. Our system,
developed in collaboration with stakeholders, offers a user-friendly platform, continuously
analyzing metrics data for algorithmic improvements. Key indicators, the Dropout Risk Index
(DRI) and Placement Satisfaction Index (SPI), predict student success and organizational
assimilation. Future plans involve combining the algorithm with additional optimization
techniques for broader applications in fields like marriage, foster care, and medicine. In
essence, our project pioneers a sophisticated technological solution, promising significant
improvements in matching and placement processes, with the potential for widespread positive
impact.

In this database project for a community center, I undertook the comprehensive task of
characterizing data, constructing a relational database, and formulating essential business
queries. Through meticulous data analysis, I identified key entities and relationships, laying
the foundation for an optimized and normalized database schema. The subsequent formulation and
execution of diverse business queries provided valuable insights into enrollment trends, teacher
performance, and statistical analyses. The project culminated in a detailed presentation
summarizing the entire lifecycle, showcasing my proficiency in practical database design and the
application of data-driven insights for informed decision-making. Overall, this project
successfully addressed the community center's data management needs, offering streamlined
solutions and actionable information.
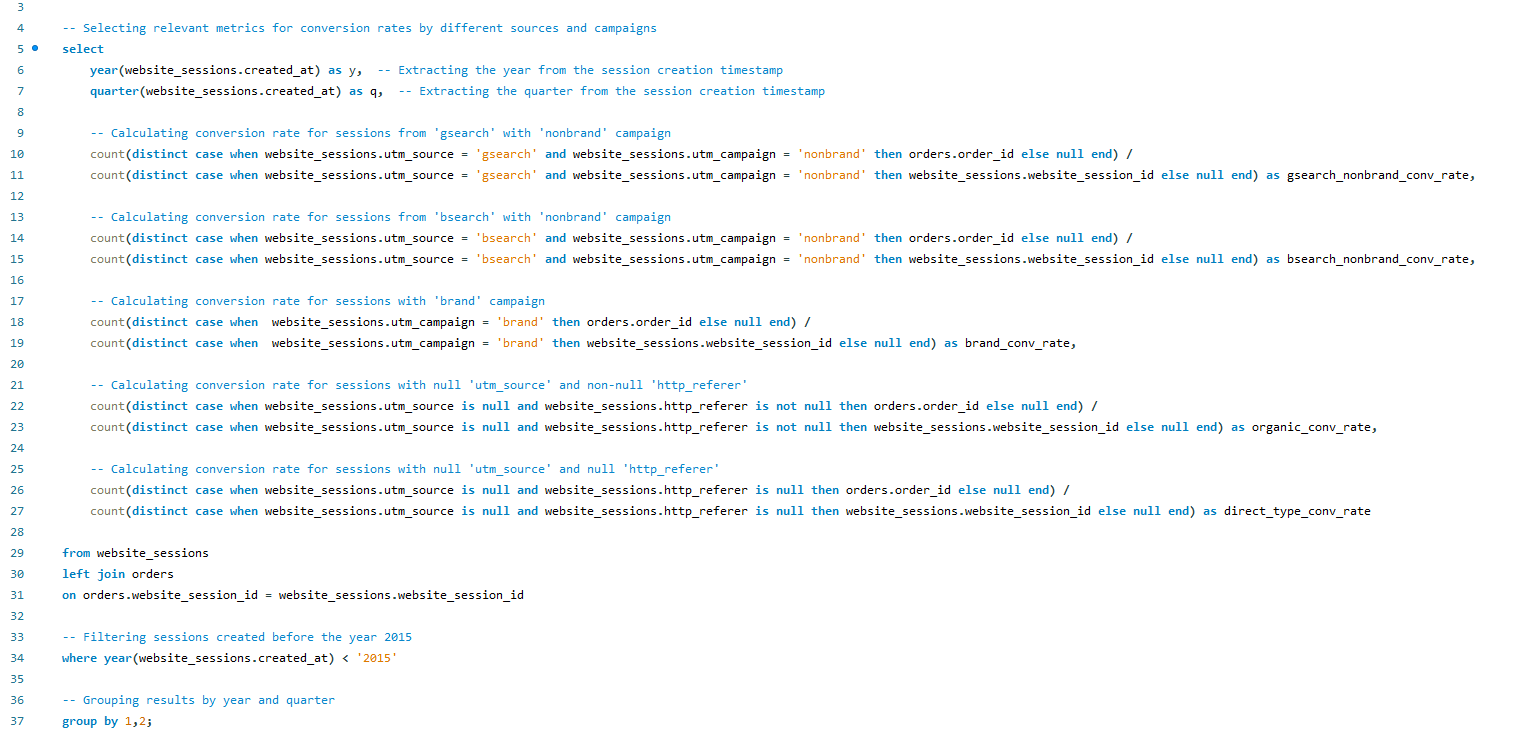
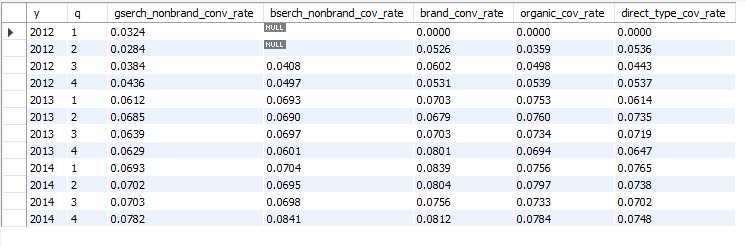
This SQL project employs a pivoting technique using the count(distinct case when) method to
construct a comprehensive conversion funnel analysis. By utilizing this method, the script
efficiently calculates distinct counts based on specified conditions, allowing for the
extraction of relevant metrics, such as conversion rates for various sources and campaigns.
This method facilitates a structured and insightful representation of user behavior within
the community center's online platform, showcasing a practical application of SQL for
pivot-style data analysis.
As a data analyst, I am actively expanding my knowledge and exploring new areas. Recently, I
embarked on a project aimed at delving deeper into the capabilities of the BeautifulSoup
library. In this project, I leveraged web scraping techniques to monitor the price fluctuations
of my favorite product on Amazon, specifically salt for popcorn. The experience of working with
the BeautifulSoup library was enjoyable and enlightening, revealing its immense power. This
project has only fueled my curiosity and eagerness to further explore and learn about this
versatile library.